Sales OLAP
Explores posted receipt data: dishes, amounts, payment methods and other sales dimensions.
Unlike a fixed table, an OLAP report lets you choose measures, groupings and filters for a specific question. In iiko you can examine revenue, dish popularity, staff activity, item consumption and other recorded data.
A restaurant group using iikoChain can configure OLAP layouts centrally and replicate them to each venue’s iikoRMS. These centrally managed layouts cannot be edited or deleted at the venue; replication replaces a local report with the same name.
Explores posted receipt data: dishes, amounts, payment methods and other sales dimensions.
Explores recorded transactions: operations that change balances on the system’s internal accounts.
Below are five iiko screens and the management questions they can help answer. Select an image to inspect the report in detail.
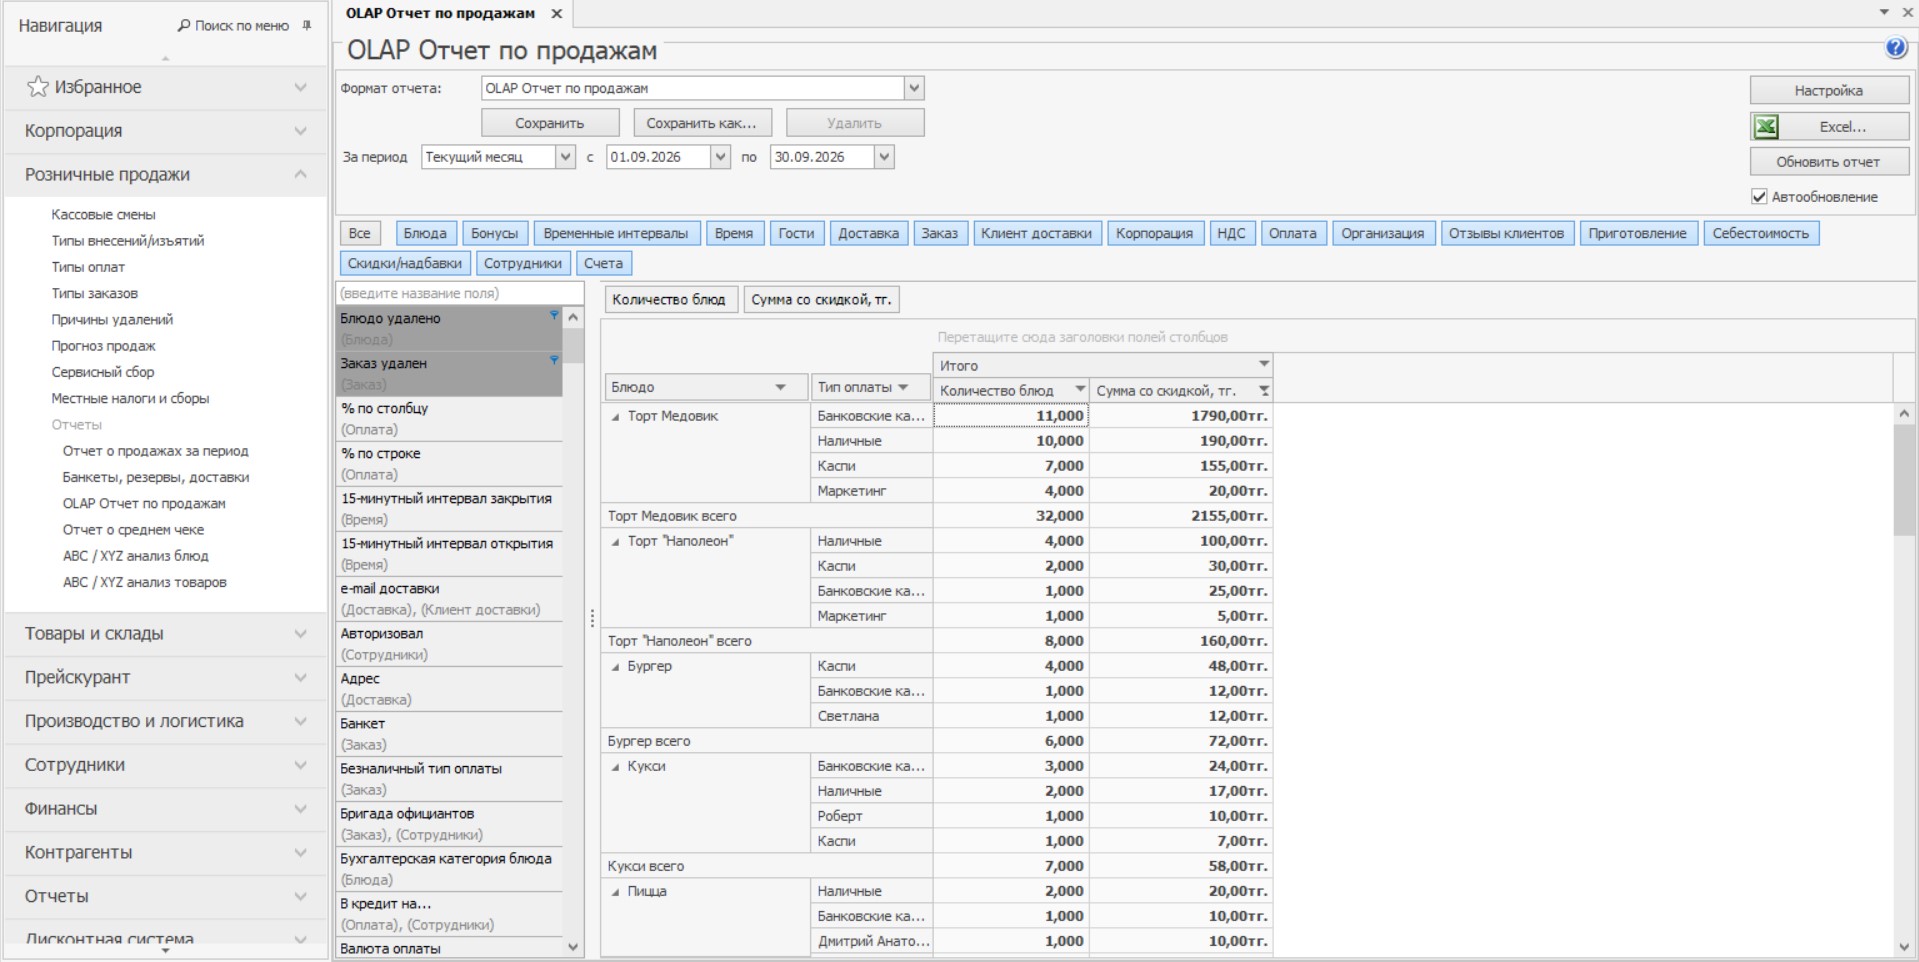
Sales OLAP analyses closed receipts. The example groups dishes by payment type and shows quantities and discounted totals. Change rows, columns, measures and filters to compare shifts, staff, menu categories, hours and order channels. Save a layout to revisit the same view.
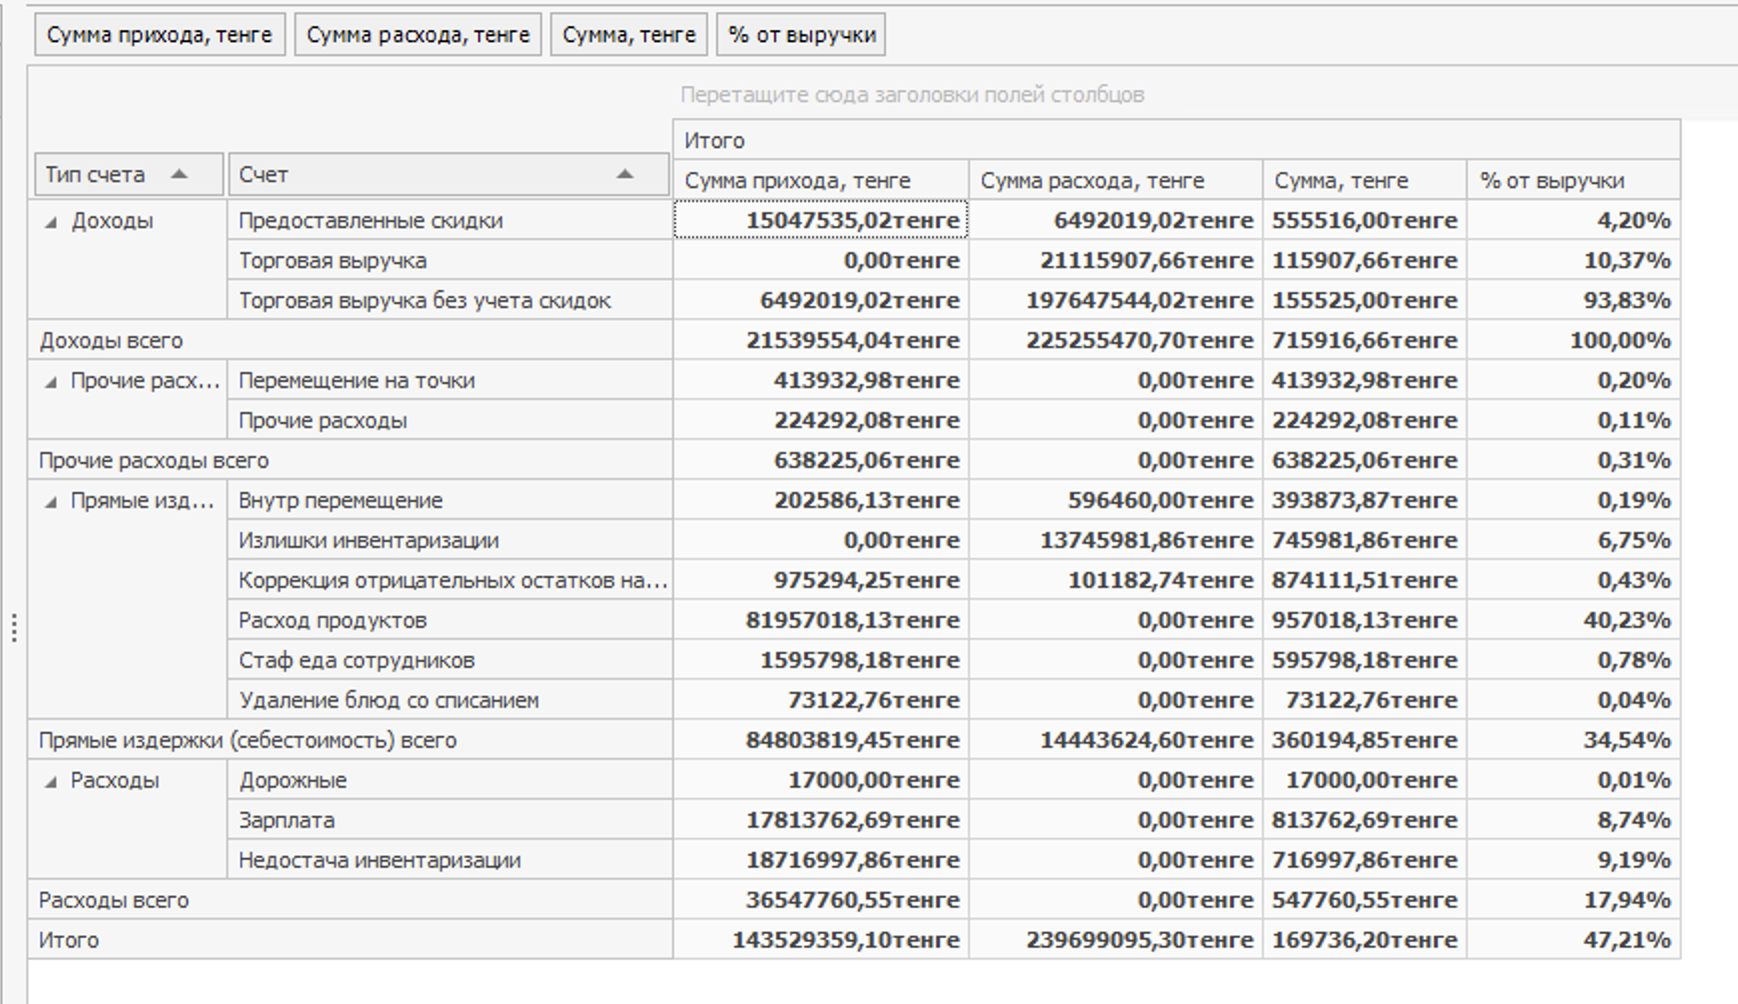
Transactions OLAP shows operations that change iiko internal account balances. In the screenshot, accounts are grouped into income, direct costs and other expenses, with incoming and outgoing amounts and a share of revenue. This helps trace costs and see which operations shaped the result.
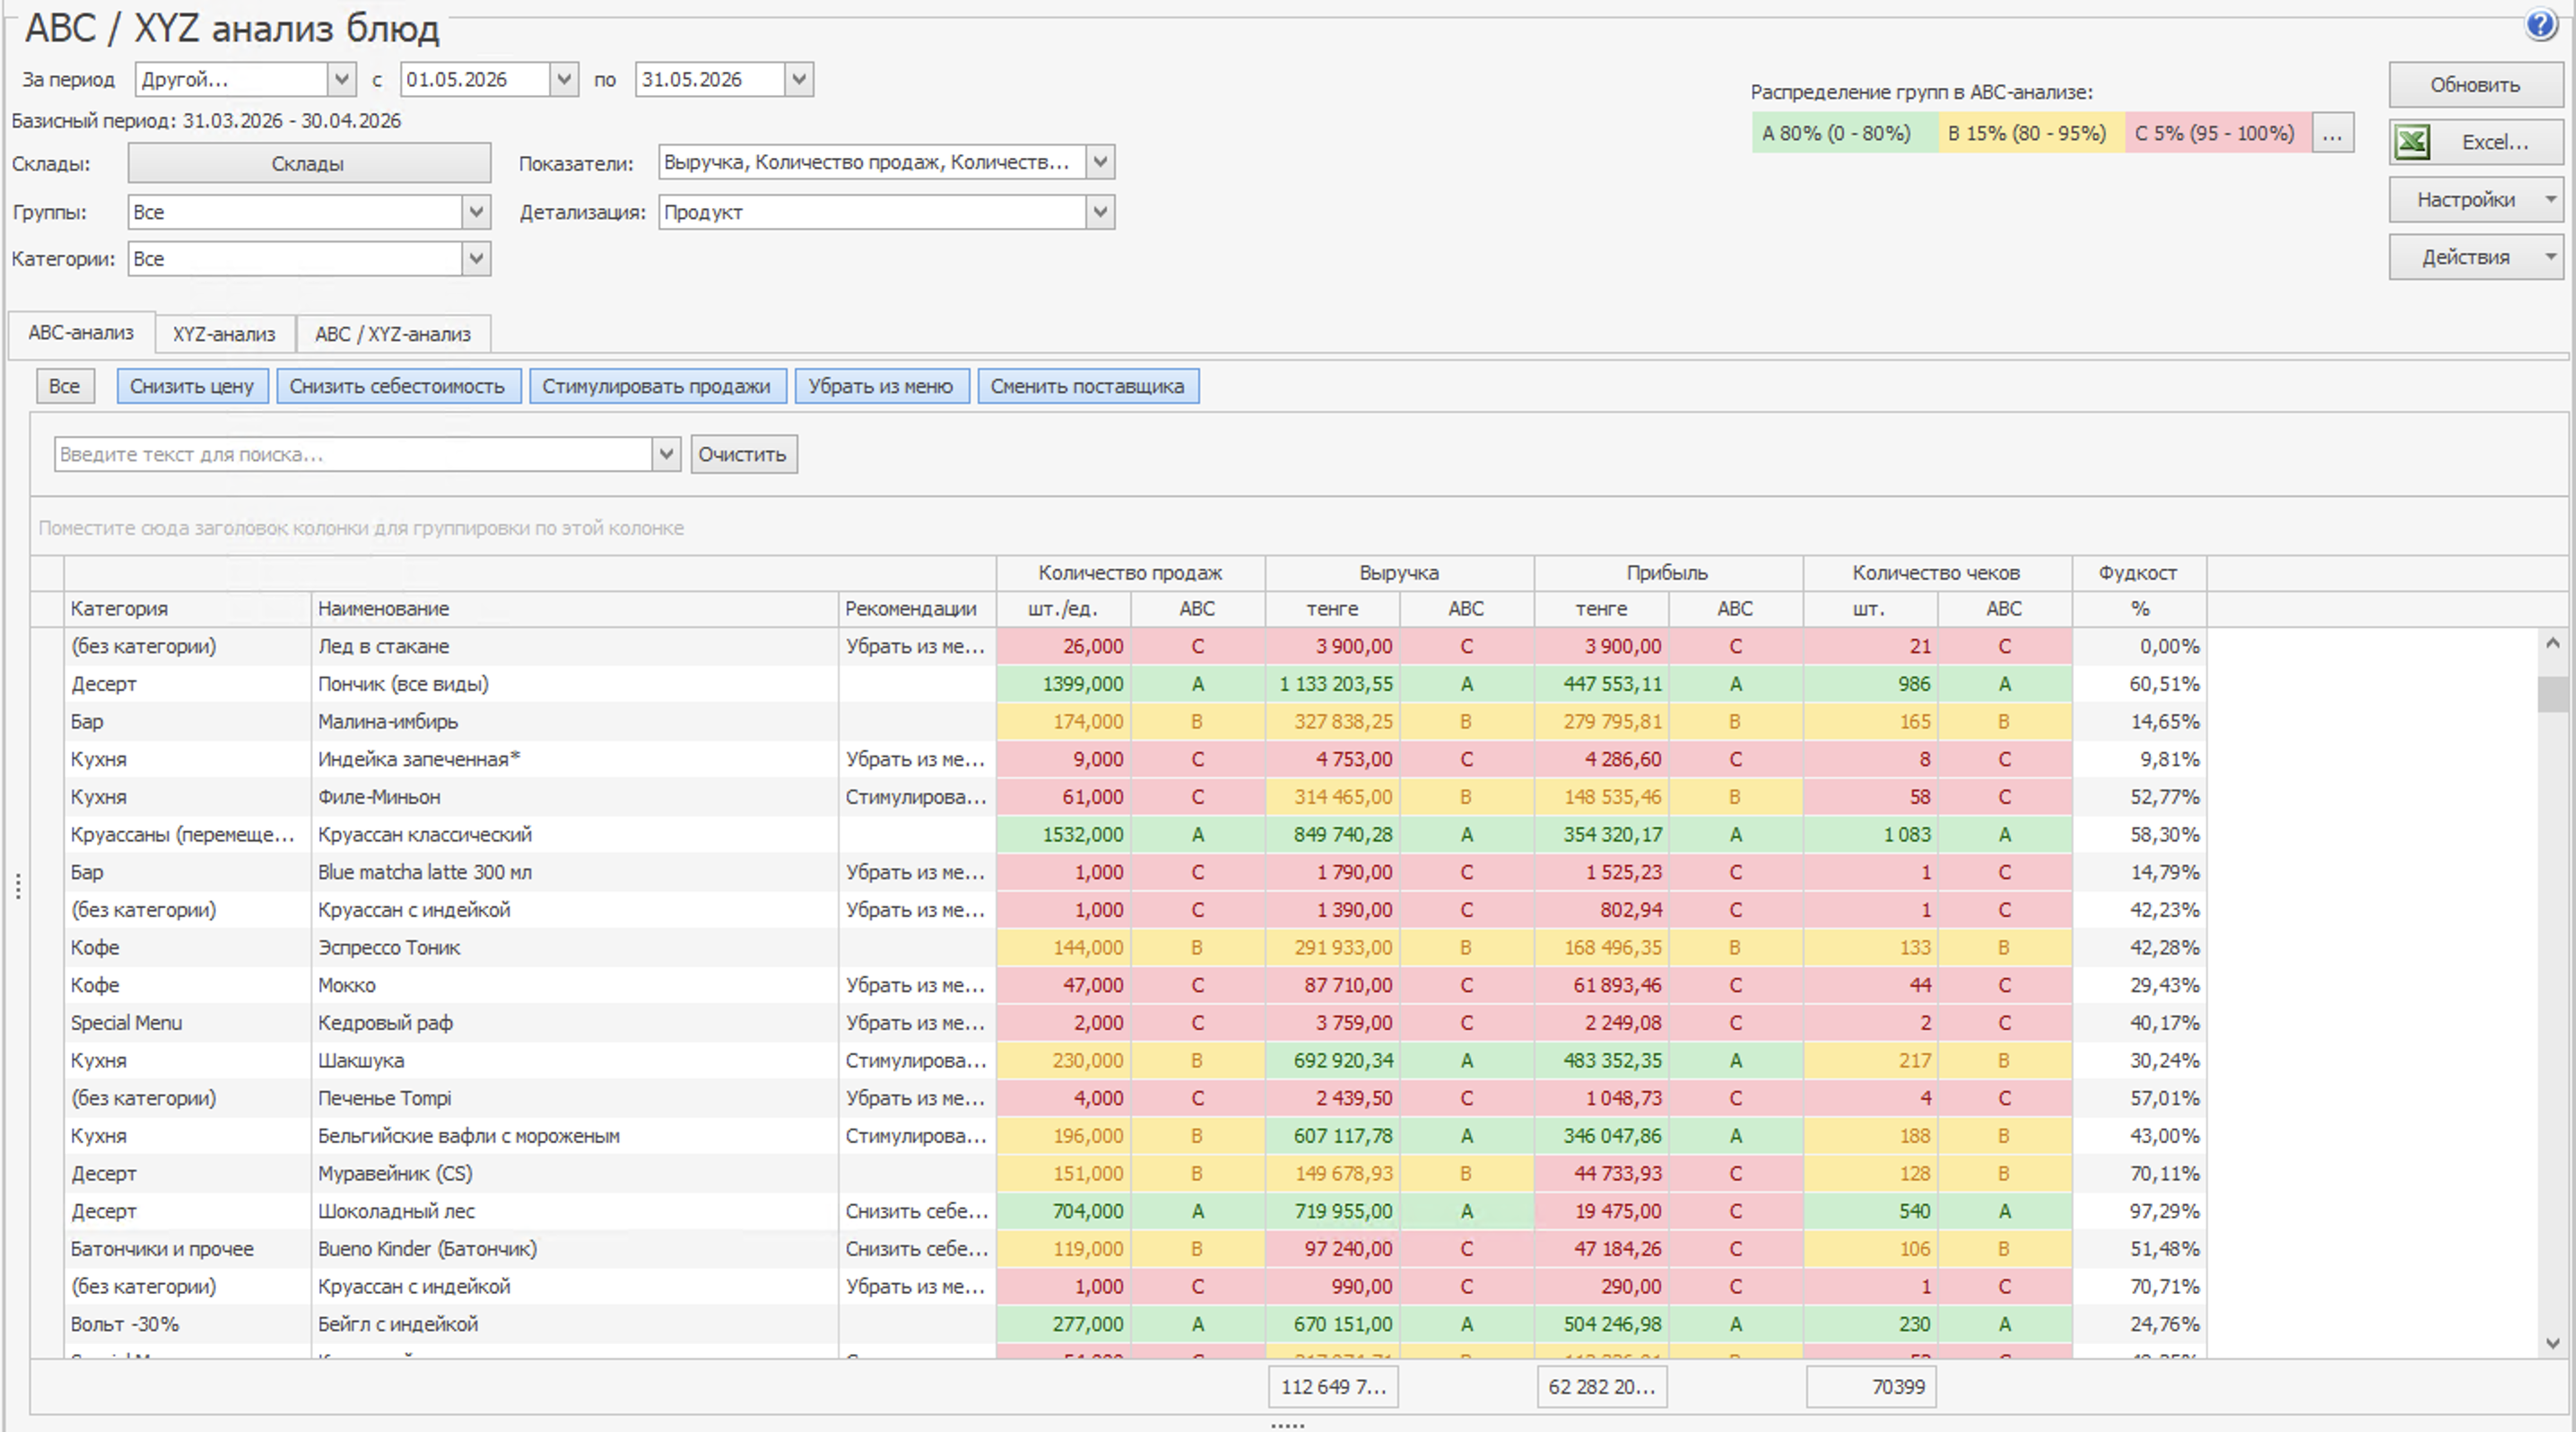
ABC groups dishes by contribution to a selected measure; XYZ groups them by demand stability. Compare sales volume, revenue, profit, receipt count and food cost. Colour-coded groups and recommendations help identify leaders and items that may need a cost review, promotion or a new place on the menu.
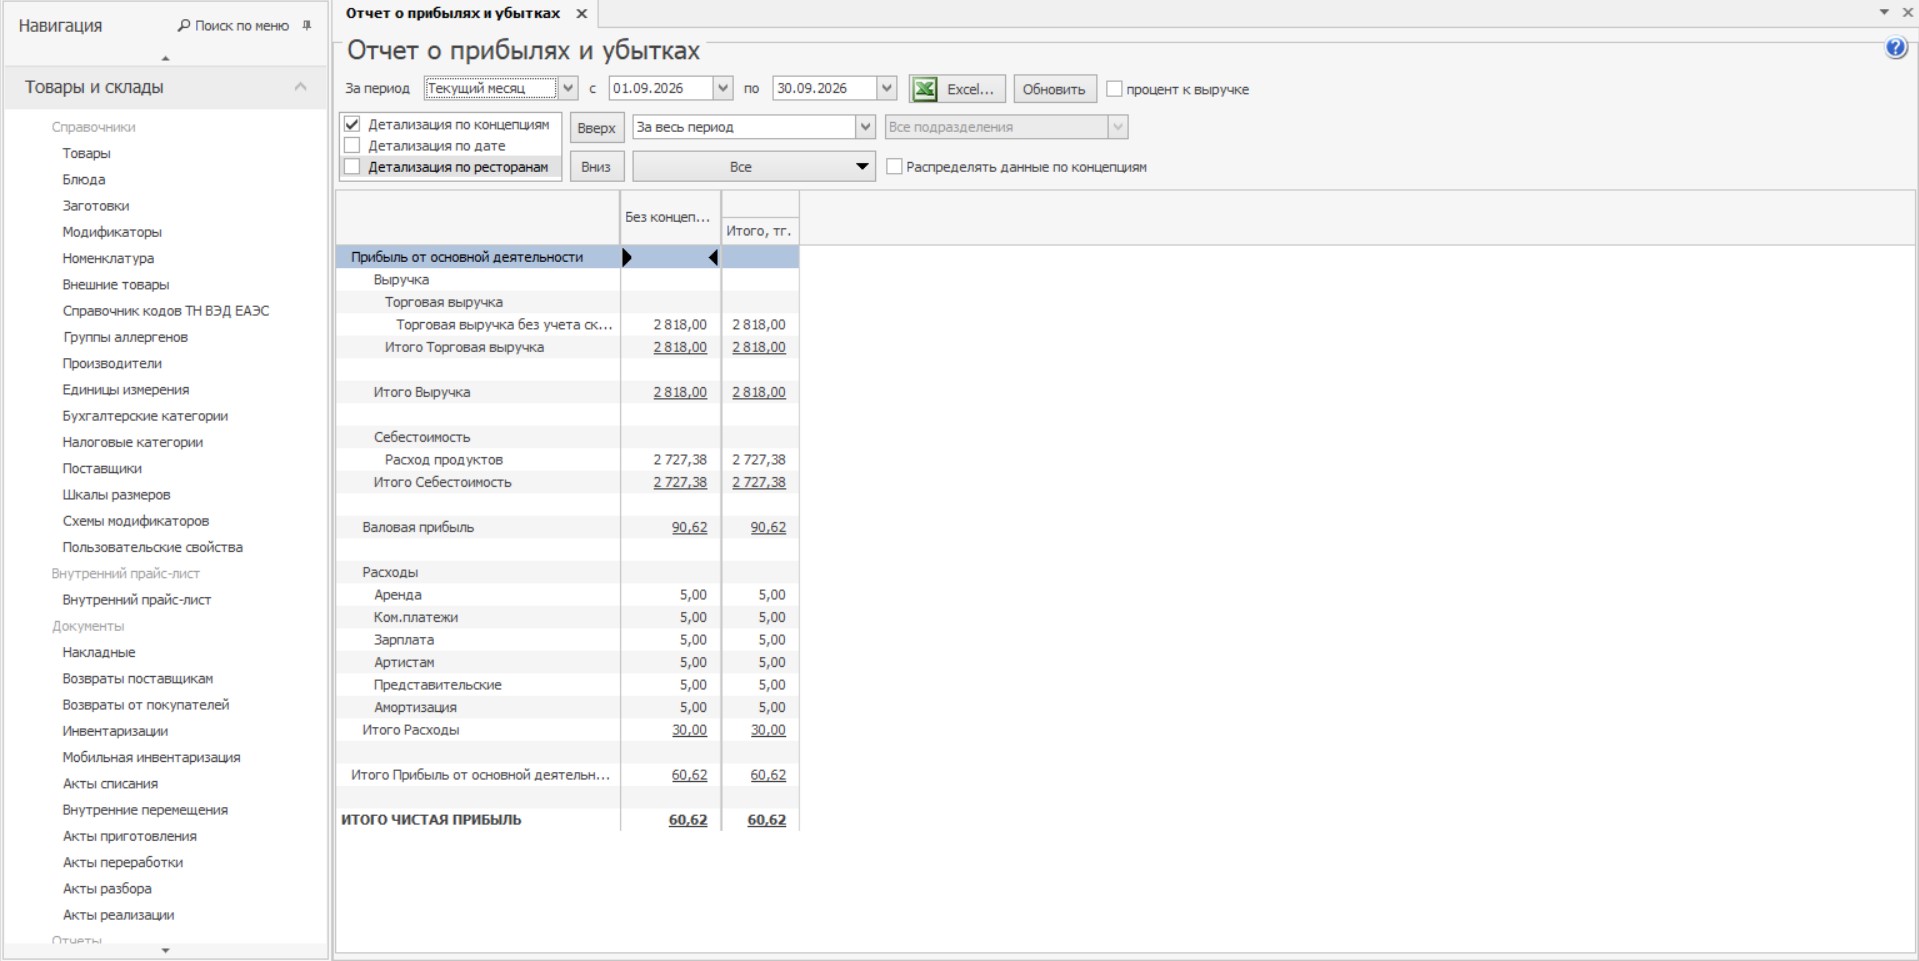
The profit and loss report brings together revenue, cost of goods, gross profit, expense categories and final profit for a period. Break it down by concept, date or restaurant to compare parts of the business. Useful figures depend on accurate purchasing records and account categories.
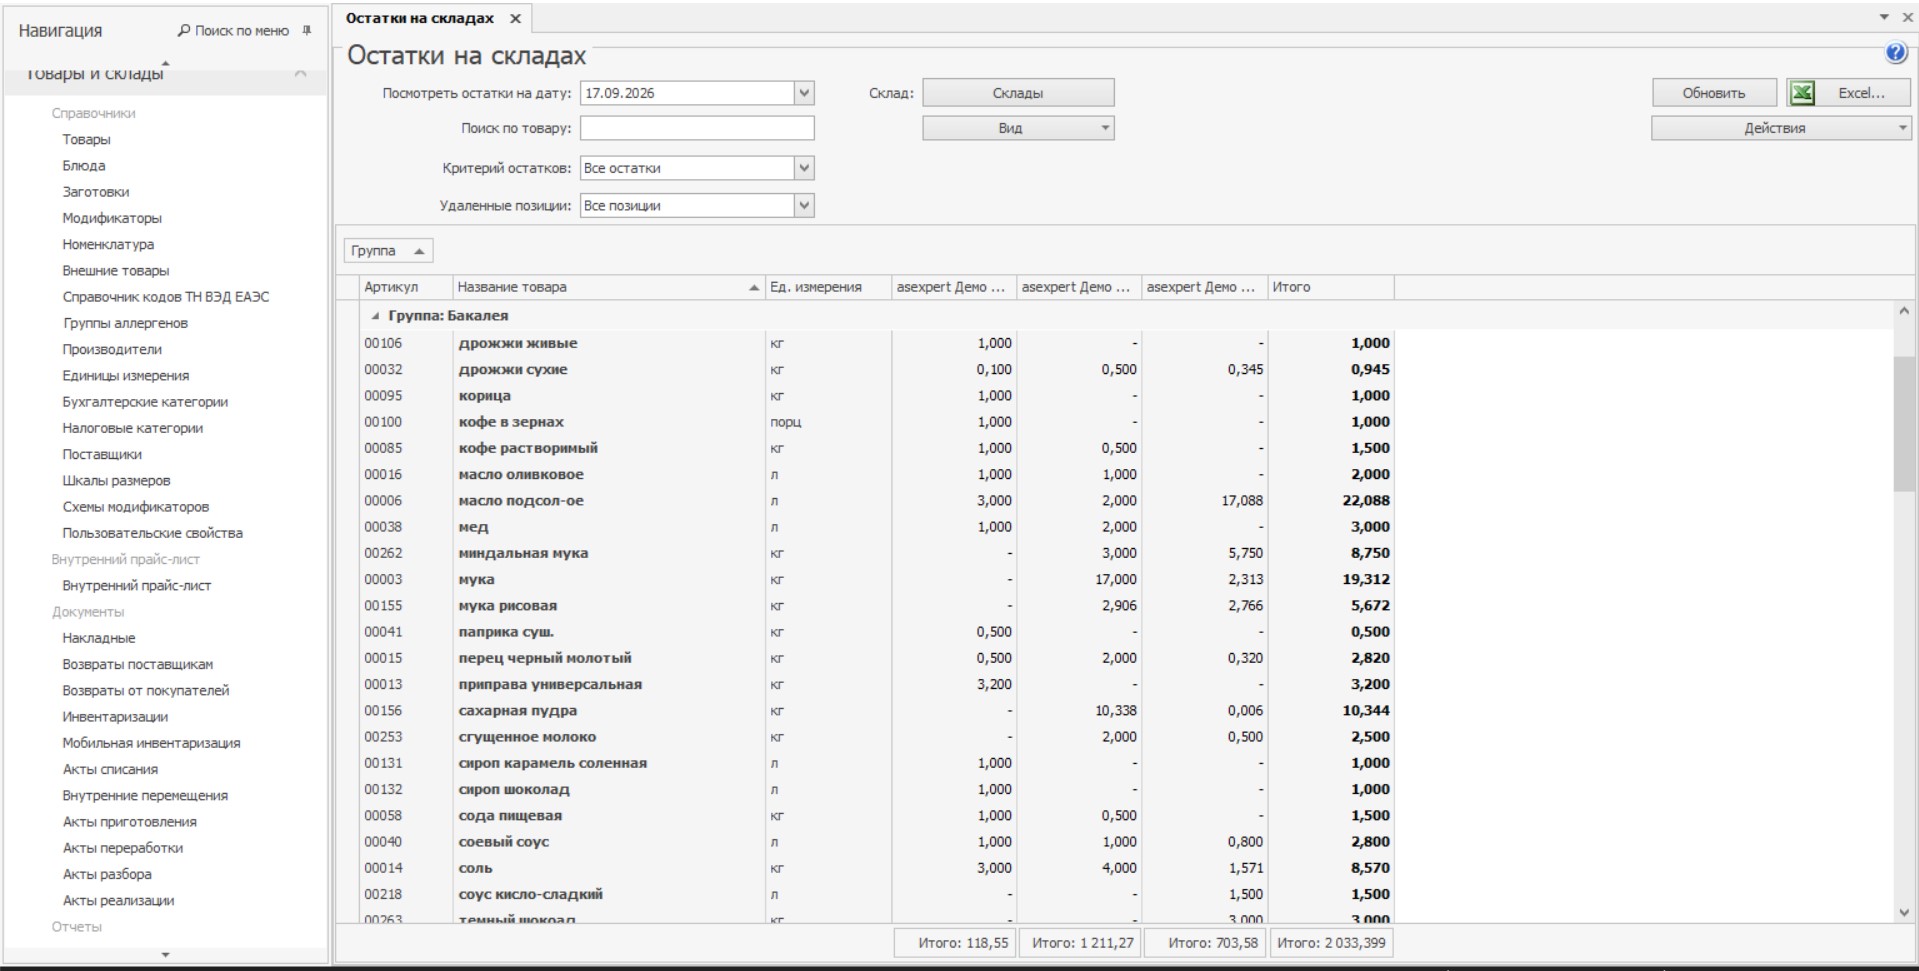
The warehouse balance report shows item quantities on a selected date, by warehouse and in total. Search and filters help find an item and spot shortages or negative balances. Invoices, write-offs and stocktakes can then be checked to investigate the difference.
Revenue reports cover tables, stations by day, waiters, hours, dishes by till, payment types and dish categories, plus daily revenue. These views show when and where demand is created.
Till balance helps reconcile till activity, while the receipt report lets you inspect individual guest payments. Together with sales OLAP, they connect totals to individual receipts.
The balance sheet shows assets and liabilities, profit and loss shows the result for a period, and cash flow shows money received and paid. Read together, they distinguish profitability from available cash.
Tell us about your venue or group. We can select reports, configure the views you need and show your team how to use them day to day.
Tell us about your business. We will match iiko, equipment and integrations to your workflow.
+7 747 22 000 33